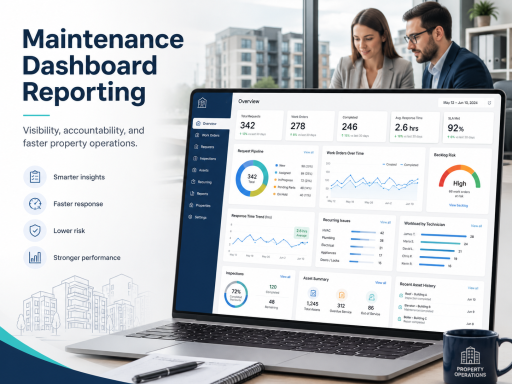
Maintenance reporting is the difference between reacting to noise and managing operations with control. When requests, work orders, and inspection outcomes are scattered across email threads, spreadsheets, and phone calls, reporting becomes manual, inconsistent, and often too late to prevent resident dissatisfaction or escalating costs. A centralized reporting model turns daily maintenance activity into measurable performance—by unit, building, property, and portfolio.
This guide explains how property managers can structure portfolio maintenance reporting to expose bottlenecks, reduce repeat issues, and improve response time. It also shows how reporting becomes more accurate when it is connected to the operational system of record—work orders, inspections, assets, and property structure—rather than compiled after the fact.
Why Reporting by Unit, Building, and Property Matters
Portfolio-level totals can hide operational problems. Two properties can show the same number of completed work orders while delivering very different resident experiences. The only reliable way to understand performance is to analyze work at the location level—where issues occur and where teams operate.
- Unit-level reporting helps identify recurring problems, repeat visits, and patterns tied to specific apartments.
- Building-level reporting highlights systemic issues like shared plumbing stacks, electrical loads, or aging infrastructure.
- Property-level reporting exposes staffing constraints, vendor performance differences, and inconsistent processes across sites.
When reporting is structured this way, maintenance leaders can prioritize investments, adjust staffing, and reduce repeat incidents with evidence instead of assumptions.
Start With Clean Operational Data, Not Manual Spreadsheets
Reporting quality is driven by data quality. If work is tracked inconsistently, analytics becomes unreliable. The foundation is a standardized workflow where every request and work order follows a consistent lifecycle—from intake to completion—capturing the same essential fields every time.
TaskEstate supports this foundation through a centralized operating model that connects reporting to daily execution in property maintenance software. When reporting is generated from the same system that teams use to run maintenance, results become timely, consistent, and defensible.
Define the Core Metrics That Property Managers Actually Use
Effective maintenance reporting is not about collecting more data. It is about surfacing metrics that drive action. Most property maintenance teams benefit from a focused KPI set that covers speed, throughput, quality, and workload.
Speed
- Time to approve: how long requests wait before becoming actionable work.
- Time to assign: how quickly work moves from approved to owned.
- Time to first touch: how long it takes for staff to begin work after assignment.
- Time to completion: end-to-end resolution time.
Throughput
- Open backlog: current open work orders by status and age.
- Closed volume: completed work orders by time period and property.
- Work mix: distribution by category (plumbing, HVAC, electrical, etc.).
Quality
- Repeat work rate: how often the same unit/issue returns within a defined window.
- Follow-up rate: how often additional work is required after completion.
Workload
- Assignments by staff: workload distribution and capacity indicators.
- Aging by queue: where work sits (awaiting approval, assigned, in progress, pending inspection).
These metrics become dramatically more actionable when you can filter and compare them by unit, building, and property.
Work Orders ↔ Reporting ↔ Inspections: Build a Closed-Loop Measurement System
Many teams report only on “tickets closed,” which can conceal quality problems. A portfolio reporting model should connect work execution to inspection verification where appropriate, creating a closed loop between completion and outcomes.
Operationally, that closed loop depends on three linked components:
- Standardized work execution via work order management.
- Portfolio KPIs and visibility using maintenance dashboards and reporting.
- Quality validation and documented outcomes through property inspections.
When these are connected, reporting can show not only what was completed, but whether it stayed resolved—reducing repeat complaints and supporting service-level consistency across the portfolio.
Properties/Units ↔ Assets ↔ Reporting: Add the Context That Explains Trends
Location-based reporting answers where problems occur. Asset context answers why problems recur. Without asset history, teams repeatedly diagnose the same equipment and struggle to justify replacements. With asset context, reporting supports lifecycle decisions.
This is where portfolio structure and asset records become critical:
- Portfolio structure ensures every record is tied to the correct place using property, building, and unit management.
- Asset history adds lifecycle context through asset installation records, supporting repair-versus-replace decisions and preventive planning.
With this context, reporting can highlight patterns like “repeat HVAC repairs in Building B” or “increasing plumbing work orders for units with older installations,” enabling targeted, cost-effective interventions.
Reporting Views Property Managers Should Standardize
To make reporting operational, standardize a small set of views that teams review on a routine cadence (daily, weekly, monthly). These views should be consistent across properties so performance is comparable.
Daily Operations View
- Open work orders by status and age
- Items pending approval or assignment
- High-priority work orders requiring escalation
Weekly Performance View
- Average time-to-assign and time-to-complete
- Backlog trend (improving or worsening)
- Repeat work and follow-up indicators
Monthly Portfolio View
- Property-to-property comparisons
- Top recurring issue categories by property
- Staffing or vendor capacity indicators
- Asset-driven patterns and replacement candidates
These views help property managers move from reactive response to controlled operations—where decisions are supported by measurable signals.
Common Reporting Mistakes and How to Avoid Them
- Measuring only volume: “tickets closed” without speed and quality hides resident pain. Include time and repeat-work metrics.
- No location context: reporting that cannot break down by unit/building/property cannot reveal root causes. Use structured portfolio hierarchy.
- Inconsistent statuses: if teams interpret statuses differently, aging and backlog metrics become unreliable. Standardize workflow stages.
- Reporting too late: monthly-only reviews do not prevent daily bottlenecks. Establish daily and weekly operational views.
Next Step: Make Reporting Operational, Not Aspirational
Portfolio maintenance reporting works when it is tied to execution. Centralize work orders, structure location data, connect inspections where needed, and measure performance continuously. The goal is simple: faster response time, better accountability, and fewer repeat issues—without additional administrative overhead.
If you are evaluating how to implement reporting across your properties, review options and packaging on the pricing page.
FAQ
What is the most important maintenance KPI for property managers?
Most teams start with response time and completion time because they directly affect resident satisfaction and operational throughput. From there, add repeat-work indicators to ensure quality is improving, not just speed.
How do I report maintenance performance by property and unit?
Reporting by property and unit requires a structured portfolio model so every request and work order is tied to the correct location. With that structure, you can compare performance across buildings and identify recurring issues at the unit level.
How do inspections improve reporting accuracy?
Inspections provide an outcome check that confirms whether work was completed correctly. When inspection results are connected to work orders and reporting, teams can quantify quality and reduce repeat incidents.
How do asset records help reduce repeat work orders?
Asset records add lifecycle context—what was installed, where, and when—so teams can identify recurring failures and justify replacement planning based on evidence rather than guesswork.