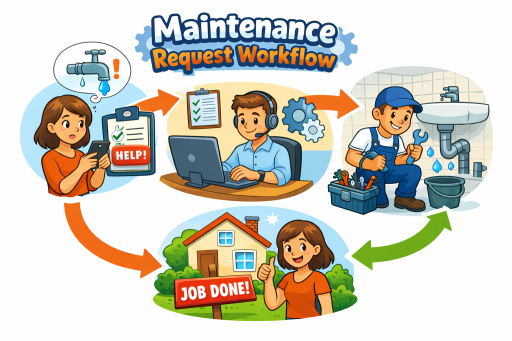
Property managers do not lose time because maintenance is inherently complicated. Time is lost because information arrives inconsistently—different people describe the same problem in different ways, priorities are assigned subjectively, and teams cannot easily see patterns across properties. The fastest way to improve response time and accountability is not adding headcount. It is standardizing how requests are categorized, prioritized, and routed so triage becomes a repeatable process instead of a daily debate.
This guide provides a practical categorization framework you can implement across your portfolio. You will learn how to define categories, build priority rules, reduce duplicate tickets, and translate day-to-day maintenance activity into reliable operational reporting.
Why categorization is a performance lever, not an admin exercise
When maintenance requests are categorized well, several operational outcomes improve immediately:
- Faster triage: staff and managers know what they are looking at and what to do next.
- Cleaner approvals: higher-cost or higher-risk categories can trigger review automatically.
- Better assignment: categories route work to the right team (in-house, vendor, specialist) without guesswork.
- Reliable reporting: trends become visible, repeat issues are measurable, and staffing decisions can be justified.
- Stronger resident experience: residents get consistent expectations and faster resolution when requests are captured correctly.
Most teams already “categorize” informally. The problem is the taxonomy lives in people’s heads or in spreadsheets that change by site. A standardized model belongs in a centralized operations system such as property maintenance software, where request intake, triage, execution, and reporting all reference the same definitions.
Step 1: Start with a simple category framework that scales
Your category model should be simple enough that residents and staff use it consistently, but structured enough to support analytics. A practical baseline is a two-level taxonomy:
- Category: the broad system or area (e.g., Plumbing, Electrical, HVAC).
- Issue type: the specific problem within the category (e.g., “Leak under sink,” “No power in outlet,” “AC not cooling”).
For most portfolios, 8–12 top-level categories is the sweet spot. Too few and reporting becomes meaningless. Too many and adoption collapses. Common top-level categories include:
- Plumbing
- Electrical
- HVAC
- Appliances
- Doors/Locks
- Water Intrusion / Leaks
- Pest / Environmental
- Common Areas
- Safety / Emergency
- Other (use sparingly and review weekly)
Implementation rule: if “Other” exceeds 10–15% of monthly volume, your taxonomy is missing issue types or users need better guidance.
Step 2: Define priority rules that remove ambiguity
Categorization is only half the battle. Priority rules are what turn a categorized request into actionable triage. The goal is to reduce subjective decision-making and create consistent service levels across properties.
Use a priority model that combines impact (safety, habitability, property damage risk) and urgency (how quickly the issue escalates). A practical framework:
- Emergency (P0): immediate safety risk or active damage (e.g., flooding, gas smell, no heat in freezing temps).
- Urgent (P1): significant disruption or risk of escalation within 24–48 hours.
- Standard (P2): routine repairs and non-critical issues.
- Low (P3): cosmetic or deferrable items.
Then map each issue type to a default priority. You can allow managers to override priorities, but defaults reduce errors and speed up intake processing.
When priorities and categories are standardized, work flows more predictably into execution through work order management software for property maintenance, where approvals, assignment, and status tracking follow a consistent path.
Step 3: Standardize request intake so categories are accurate
Accurate categorization requires consistent intake fields. At minimum, capture:
- Location: property, building, unit, and specific area (kitchen/bath/living room).
- Category and issue type: selected from your taxonomy.
- Symptoms: short structured prompts (e.g., “leaking,” “no power,” “not cooling”).
- Access notes: entry permissions, pets, preferred times.
- Photos (optional but recommended): reduce repeat visits and misdiagnosis.
Resident-facing intake should be simple and guided. A portal that presents the right choices and prompts reduces free-text ambiguity while improving speed. This is where a structured resident maintenance requests portal helps prevent misclassification and cuts down on back-and-forth before work is even approved.
Step 4: Connect categorization to inspections and quality verification
Categories should do more than route work. They should also trigger verification when the risk profile demands it. For example:
- Water intrusion or leak categories can require inspection confirmation after completion.
- Safety-related items can require an inspection sign-off or documentation standard.
- Recurring issues can trigger inspection to validate root cause rather than repeated patch repairs.
This is how you preserve the “closed-loop” operational model: Work Orders ↔ Reporting ↔ Inspections. Categorization supplies the structured data that makes this loop work. For inspection workflows and documentation, use property inspection software for buildings and units to keep verification consistent and auditable.
Step 5: Make reporting meaningful by tying categories to location
Even perfect categories fail if reporting is not location-aware. Portfolio leaders need to answer questions like:
- Which buildings generate the most HVAC work orders?
- Which units have repeat plumbing issues?
- Which properties have long completion times for specific categories?
To do this, every request must be tied cleanly to the portfolio structure—properties, buildings, and units—so category trends can be analyzed accurately. A structured location model such as property, building & unit management is essential for reporting that property managers can trust.
Once location structure and categories are standardized, the reporting layer becomes actionable. You can monitor volume, backlog, and repeat issues by category and location through maintenance dashboards and reporting that support staffing decisions, vendor strategy, and preventive planning.
Step 6: Add asset context to improve root-cause analysis
Categories tell you what type of problem is occurring; asset history helps you understand why it keeps happening. If “HVAC not cooling” spikes in one building, the next question is whether those units share equipment age, model, or install timeframe.
When requests and work orders are connected to asset context, teams can move from repetitive repair cycles to lifecycle decision-making. Installation history and asset records—captured through asset installation records for property maintenance—help identify when a category trend is actually an asset replacement signal.
This completes the second adjacency loop you specified: Properties/Units ↔ Assets ↔ Reporting. Categorization is the data foundation; assets provide the lifecycle context; reporting turns both into decisions.
Step 7: Use permissions to protect workflow quality
To keep categorization consistent, decide who can create, edit, or redefine categories and priorities. In many teams, allowing everyone to modify taxonomy leads to drift and destroys reporting quality. A better pattern:
- Residents: choose from guided categories and issue types, but cannot edit taxonomy.
- Maintenance staff: can refine issue types or add notes, but taxonomy changes are restricted.
- Managers/admins: own taxonomy governance, priority mappings, and approval rules.
This governance is easiest when roles and permissions are explicit through user and role management for property maintenance teams, ensuring operational data stays clean while teams still move quickly.
A practical rollout plan for property managers
- Week 1: define 8–12 top-level categories and 5–10 issue types per category.
- Week 2: map default priorities to issue types and define escalation thresholds.
- Week 3: train staff on category selection and closeout notes; review “Other” usage daily.
- Week 4: publish a baseline dashboard showing volume, backlog, and repeat issues by category and location.
Within a month, most portfolios see clearer triage, fewer internal follow-ups, and reporting that supports operational decisions rather than anecdotal management.
Next step
If you want to replace emails, spreadsheets, and phone calls with a consistent categorization and triage workflow, start by centralizing intake, approvals, execution, inspections, and analytics in one operational system. For feature coverage and implementation alignment, review the platform modules and plans on the pricing page.
FAQ
How many maintenance categories should we use?
Most portfolios perform best with 8–12 top-level categories and a manageable set of issue types beneath each. Fewer categories reduce reporting usefulness; too many categories reduce adoption and data quality.
Should residents choose categories, or should staff do it?
Residents can choose guided categories and issue types if the intake experience is structured. Maintenance staff can refine classification during execution. The key is consistent defaults and limited taxonomy editing rights.
How do categories improve reporting accuracy?
Categories standardize what work is being done, while location structure ties work to the correct property, building, and unit. Together, they enable trend analysis and performance measurement by category and location.
How do we reduce repeat requests using categorization?
Use reporting to identify repeat issues by category and location, validate outcomes with inspections when appropriate, and add asset context to determine when replacement is more cost-effective than repeat repairs.